Schedule Metrics

Source PSEG
Critical Path Length Index
The Critical Path Length Index (CPLI) measures how realistic the program completion date is, based on the remaining duration of the critical path and the amount of total float available. CPLI is one of the standard Schedule Health Assessment Metrics and identifies programs that are having difficulty executing their critical path. The target for CPLI is 1.0 or greater. A lower value indicates an increased risk of being late at program completion.
Where Critical Path Length is the number of days from time now to the early finish date of the task or milestone representing program completion.
Total Float on the task or milestone representing program completion may be either positive or negative.
The result is an index that measures the sufficiency of the total float available relative to the remaining duration of the critical path.
For example, 20 days of float on a critical path that has 80 days remaining would result in a CPLI of 1.25 indicating a low risk of not completing on time.
However, if the critical path has 800 days remaining, a total float of 20 days would result in a CPLI of 1.03. Although this is still above the target of 1.0, it indicates there is much less room for error. To achieve a CPLI of 1.25 in this case would require 200 days of total float.
CPLI also measures the relative efficiency required to complete the program critical path on time. A CPLI of 1.00 means the program has 0 days of total float available on the critical path and therefore should accomplish one day’s worth of work for every day that passes. This means the program should execute the critical path at a 100% efficiency rate to complete on time.
A CPLI less than 1.00 indicates that the program is not executing the critical path as planned and has created a negative total float condition potentially delaying program completion.
To prevent this from happening, the program should now accomplish more than one day of work for every day that passes. This means the program should now execute the critical path at an efficiency rate higher than 100%.
Likewise, a CPLI greater than 1.00 indicates that the program is executing the critical path ahead of plan and still has positive total float remaining. As a result, the program has a lower risk of delaying program completion since they can operate at an efficiency rate of less than 100% and still complete on time
Typically, programs calculate CPLI to program completion or an interim milestone. Any activities on or near the program critical path can directly impact this metric if not completed as planned.
Note: CPLI will not work correctly, if the network does not have a constrained finish date on the task representing program completion, because the result would be a Critical Path that has zero total float and a CPLI of 1.00 at all times.

BEI baseline execution index
BEI is a summary level snapshot measuring how well the program (or a portion of the program) has actually performed to the baseline plan.
The BEI is a simple index measure of a count of completed tasks with a count of tasks scheduled to be completed. As with most indices, 1.0 is ideal, a number greater than 1.0 indicates more task completions than planned and a number less than 1.0 indicates fewer completed tasks than planned.
Management can use this metric to evaluate schedule progress towards the baseline plan. BEI is similar in function to the Schedule Performance Index (SPI), except it is a ratio based on a simple task count.
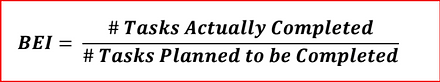
# Tasks Actually Completed – Count of activities with a status updates for Actual Finish dates on or before the status date of the IMS
# Tasks Planned to be Completed – Count of activities with a Baseline Finish date on or before the status date of the IMS
Note: While there may be exceptions under certain circumstances, programs typically exclude the following activity categories from BEI counts and calculations: Level of Effort (LOE) and Milestones.
Programs can calculate BEI as often as the schedule has its status updated (typically weekly or monthly).

Current Execution Index
The goal of this metric is to measure and indicate how well the near-term schedule represents what actually takes place through execution. This measurement provides insight into the accuracy of the forecast schedule and its abilities as a predictive model.
The index maximum is 1.00, but a sound forecast schedule will consistently trend in the greater than 80th percentile range. There is a direct correlation between the lower probability (less than 80 % probability of completion) and the program’s ability to manage the projected near-term tasks. This indicates that work is slipping to the right and possibly adding to the “bow wave” of unachievable work.
Use of the CEI metric drives ownership and accountability behaviours that are necessary for program success when consistently used by program management.
You can derive CEI by comparing the number of tasks forecasted to finish within the status period to the number of those tasks that actually did finish within the status period.
The process for collecting the data necessary to calculate CEI is as follows:
1. At the beginning of the status period, create a “snapshot” of the status period (capturing
Forecast Finishes).
2. Execute through the status period.
3. Retrieve initial “snapshot”.
4. Compare actual finish dates to the initial “snapshot”.
Program teams that can effectively manage the road ahead have a higher percentage of success. The intent of CEI is to focus the program team on ensuring the forecast schedule is accurate and then executing to it as effectively as possible.
Note: Tasks in this formula should exclude LOE and Summary lines (but should include all other tasks/milestones). Be careful when establishing the parameters of this metric, unlike BEI, the numerator should contain only tasks that were previously forecasted to finish and did finish
in the defined window.
Example
37 = # of tasks forecasted to finish in the window
29 = # of tasks that finished in the window (out of the 37 forecasted to finish in
the window)
CEI = 29/37 = .78

Total Float Consumption Index
The focus of the TFCI is to provide a duration-based performance index calculating total float consumption as an efficiency factor.
The TFCI can be used to assess the achievability of the project completion date in any network schedule rather than just using the total float as a static indicator of projected completion. Program personnel use TFCI to estimate a projected forecast finish date.

Note: If the Critical Path Total Float is not being calculated to the baseline finish of the project, Baseline Finish Variance should be used in place of CPTF.
For any schedule using the critical path method, such as an IMS, total float is created or consumed based on network logic, completion of activities, and constraints within.
This is commonly referred to as total float management. Managing a schedule by total float allows Applied Project Status to be quantified, Predicted Critical Path Total Float to be calculated, and a forecast finish date to be pinpointed.
A TFCI of less than 1.00 indicates that a project may not complete on-time and applying that indicator to the total program duration (as depicted in steps #1 through #4 below) predicts where a project would complete if trends persist or corrective action is not taken.
Example
Step 1: Find the TFCI
How is the program doing so far? If the TFCI is below 1.0, then the program may not complete on-time without mitigation.
Project Actual Duration = span of actual working time accrued (in days or like unit of measure), from the beginning of the program through the status date

Step 2: Find Predicted Critical Path Total Float
This provides a quantitative assessment of future total float management using the total float consumed to date as an efficiency factor. How much total float will the project have by the baseline program finish date?
CCCC = DD (TT − 11) = 22 22 (. 99 − 11) = −77
If the TFCI trend of 0.97 persists, then the project will be -71 days behind schedule at project completion instead of -23 days at the baseline program finish date.
Step 3: Find the Predicted Forecast Finish Date
Using the project calendar (which includes non-working days) add 71 working days to the baseline finish date to calculate a Predicted Forecast Finish date

Avoid exaggerating the predicted impact. TFCI functions on the premise that downstream forecasts are not adjusted based on past performance. If proper attention is given to accurate forecasting, TFCI can “double dip” the projected impact and predict a slip larger than past performance would suggest. Depending on how the IMS is modelled, the CPTF may not ever be greater than zero, even if the project is forecasted to complete earlier than planned. Because of this, TFCI is intended to be used to analyse delinquent projects only.
An inherent property of the TFCI formula is early project instability. When a project is newly underway, its Actual Duration (AD) will be small. Since AD is the denominator of the TFCI equation, any change in CPTF in the numerator will have a magnified effect on the outcome of the metric. Because of this, less emphasis should be place on TFCI during the first few months of a project.
Schedule Rate Chart
Actual Finish v. Baseline Finish
Compare the number of cumulative tasks with Actual Finish dates in each past period to the number of cumulative baselined tasks planned to finish in the period.
This indicates the difference between the planned and actual task completion rate. Programs conduct further analysis to understand the reasoning behind the variance, which could include the type of tasks, complexity of tasks, or resource availability.
Forecast Finish v. Baseline Finish
Compare the number of cumulative tasks with Forecasted Finish dates in each future period to the number of cumulative baselined tasks planned to finish in the period.
This indicates the difference between the planned and forecasted task completion rate. Programs conduct further analysis to understand the reasoning behind the variance, which could include the type of tasks, complexity of tasks, or resource availability.
Bow Wave Analysis
A schedule bow wave occurs when tasks continually slip into the future. If this continues to happen as the program progresses, it could result in an insurmountable number of tasks forecasted for completion in one or more status periods.
Programs should identify potential bow waves by comparing historical monthly completion rates to forecasted monthly completion rates.

Calculations
Actual Finish (Cumulative) – Total number of tasks with an Actual Finish prior to the end of the status period.
Forecast Finish (Cumulative) – Total number of tasks with Forecast Finish prior to the end of the status period.
Baseline Finish (Cumulative) – Total number of tasks with Baseline Finish prior to the end of the status period.
Incomplete Tasks (Status Period) – Number of tasks in the status period with an Actual Start date prior to the end of the status period and no Actual Finish date.
Things to Promote
Every task in the schedule has to be baselined for the chart to be useful Rate Chart should be created based on a statussed and validated IMS Data in this chart should be analysed and compared to the data in the SPI, CPLI, and BEI to make informed choices and drive action Investigate and understand any unusual changes in the slope of the lines at or near “Time Now”.
Sharp inclines may be an indication of an unachievable “bow wave” of effort that has been allowed to accumulate.
Avoid using LoE tasks
Schedule Diagnostics
There are numerous schedule indices, as indicated above, however these checks lack information about the “quality” of a schedule, as they do not assess the scope of work that the schedule represents, logic, methodology or resources.
The following ‘diagnostics’ can assist the discussion on ‘schedule quality’ :
Activity count – Count of Activities in progress over time periods, the number of critical activities in each time period and the cumulative number of activities starting and finishing in each time period.
Duration Analysis – Duration of activities occurring over time periods by category and the number of critical activities in progress in each time period
Duration Vs Float – Duration and Float for all activities in schedule, Depends on the ‘Set thresholds’ for acceptable duration and float values and the number of activities that meet those thresholds
Constraint Analysis – Indicates constraints in schedule including, current schedule date vs constraint date, indicates type of constraints applied and balance line indicating whether activity date is on constraint date or earlier/later.
Logic Type – Type of logic used in schedule, distribution of logic time over time periods, and total count of logical relationships over time period.
Logic Analysis – Indicates the number of relationships occurring over time periods, indicates activities with no predecessors or no successors and when these occur, and a measure of Logic density.
Lag Analysis – Indicates relationships with lag values, Indicates use of lags over time periods, and Indicates the value of the lag for each relationship.
Logic Density – Activities with a high number of relationships , when these high relationship activities occur in time and an indication of how many of the relationships are driving relationships.
All of this information is available from exporting schedule data to excel, analysing data within Excel and using Microsoft Power Queries & Apps to create visual dashboards of key metrics.
Quiz.